Presentation at SECURE 2015
The Presentation file is here. The content will be helpful if you use openioc_scan and onigiri.
The Presentation file is here. The content will be helpful if you use openioc_scan and onigiri.
I published the script automating remote malware triage with F-Response and openioc_scan.
My talk pdf “Fast and Generic Malware Triage Using openioc_scan Volatility Plugin” is uploaded to SlideShare. The code and IOC examples are located in GitHub. Please let me know if you have any question and request.
“Parameters” introduced in OpenIOC 1.1 allows embedding additional metadata about Indicators into the IOC (in more detail, see Blackhat 2013 presentation by William Gibb). I implemented functions displaying matched content details and scoring results of indicator matching.
Last year, I proposed “volatile Indicators of Compromise (IOCs)” based on RAM evidence only at SANS DFIR Summit. We can detect malware using them faster than using disk-evidence-based IOCs. Besides, we can define indicators based on not only metadata (e.g., file path) but also malware function (e.g., code injection sign, imported functions and unpacked codes). The IOCs are described according to OpenIOC specification. IOC Editor is used for defining IOCs and Redline is used for scannning IOCs.
Since then, I continued to make volatile IOCs and detect malware through the tools, but I’ve got some frustrating problems about them. First, We can’t automate IOC scanning for daily task because Redline is a GUI tool. Second, Redline is compliant with OpenIOC 1.0 but the spec doesn’t support regular expression, case sensitiveness. In addition, “AND” combination of different items (e.g., ProcessItem and RegistryItem) does not work. Furthermore, Redline cannot scan unallocated objects (e.g., dead process, unloaded kernel drivers). So I decied to make a new tool for volatile IOCs.
2 years ago, I talked about the anti memory forensic method by modifying Windows kernel data structure on victim systems at BlackHat Europe 2012. The situation is still the same.
I release Immunity Debugger and IDAPython scirpts dumping PlugX configs (and original PEs) then parsing them.
Recently, I acquired a PlugX builder/controller. This seems to be the same as the one referred in AhnLab’s APT attacks analysis report, judging from the GUI window. I tried to use it.
One day, I acquired a 16GB raw memory image on Windows7 x64 machine using MoonSols DumpIt for malware investigation. Then I tried to analyze it using Volatility Framework and Redline, but they returned no output like this:
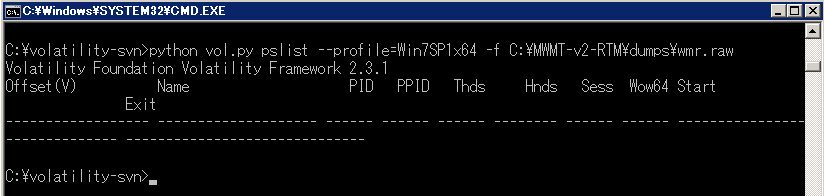
I guessed the acquired image was corrupted, so I took an image again, but the result was the same. I googled about the problem and found a similar issue. According to the report, I tested several memory acquisition tools such as FTK Imager and Windows Memory Reader, but they didn’t work.
I changed an image format from raw to crashdump. Then Volatility Framework could parse it and display the result. Strangely, Volatility also could analyze the raw image converted from the crashdump. Where does this difference come from?
Never forget to configure “advanced parameters” (check String and the length is 4)